Postgres query re-optimisation in practice
on PostgreSQL built-in reoptimisation
Today's story is about a re-optimisation feature I designed about a year ago for the Postgres Professional fork of PostgreSQL.
Curiously, after finishing the development and having tested the solution on different benchmarks, I found out that Michael Stonebraker et al. had already published some research in that area. Moreover, they used the same benchmark— Join Order Benchmark — to support their results. So, their authorship is obvious. As an excuse, I would say that my code looks closer to real-life usage, and during the implementation, I stuck and solved many problems that weren’t mentioned in the paper. So, in my opinion, this post still may be helpful.
It is clear that re-optimisation belongs to the class of 'enterprise' features, which means it is not wanted in the community code. So, the code is not published, but you can play with it and repeat the benchmark using the published docker container for the REL_16_STABLE Postgres branch.
Introduction
What was the impetus to begin this work? It was caused by many real cases that may be demonstrated clearly by the Join Order Benchmark. How much performance do you think Postgres loses if you change its preference of employing parallel workers from one to zero? Two times regression? What about 10 or 100 times slower?
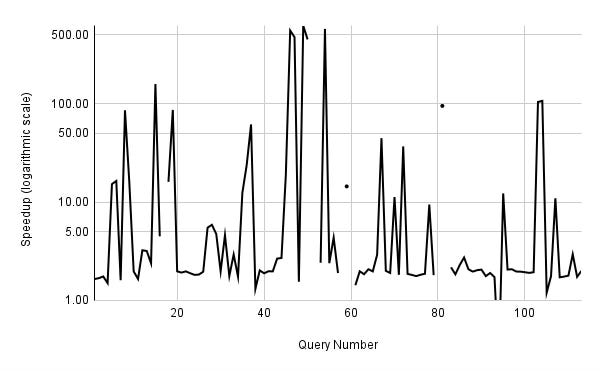
The black line in the graph below shows the change in execution time of each query between two cases: with parallel workers disabled and with a single parallel worker per gather allowed. For details, see the test script and EXPLAINs, with and without parallel workers.
As you can see, the essential outcome is about a two-time speedup, which is logical when work is divided among two processes. But sometimes we see a 10-time speedup and even more, up to 500 times. Moreover, queries 14c, 22c, 22d, 25a, 25c, 31a, and 31c only finish their execution in a reasonable time with at least one parallel worker!
If you are hard-bitten enough to replicate this experiment, you'll quickly realise that the main obstacle lies in cardinality underestimation and NestLoop join. The optimiser's tendency to predict only a few tuples on the left and right side of the join and opt for a trivial (non-parameterised) NestLoop leads to a rapid escalation in query execution time, often spiralling towards infinity when multiple NestLoops are involved in a single join tree.
With parallel workers enabled, NestLoop has an alternative Parallel HashJoin, which is less expensive because of the parallel scan on each join side. Hence, the current case is no more than a game of chance, but it demonstrates our issue: sometimes query execution time goes to the moon, and we can't get at least EXPLAIN ANALYSE data to find out what's gone wrong.
In real-world scenarios, users rarely have a pg_query_state extension installed in the production instance, and auto_explain requires the query execution to be completed. Also, disabling NestLoop or MergeJoin reduces the optimiser's ability to find good query plans with parameterised NestLoop, as I have shown in the post before. So, to find out the origin of the specific issue, we at least need something in-core to get an execution state snapshot and, at best, have a tool for dynamic replanning to fix the optimiser gaffes, that at the same time, must be transparent to the application.
Being underpinned by these wits, I began the development.
How does it work?
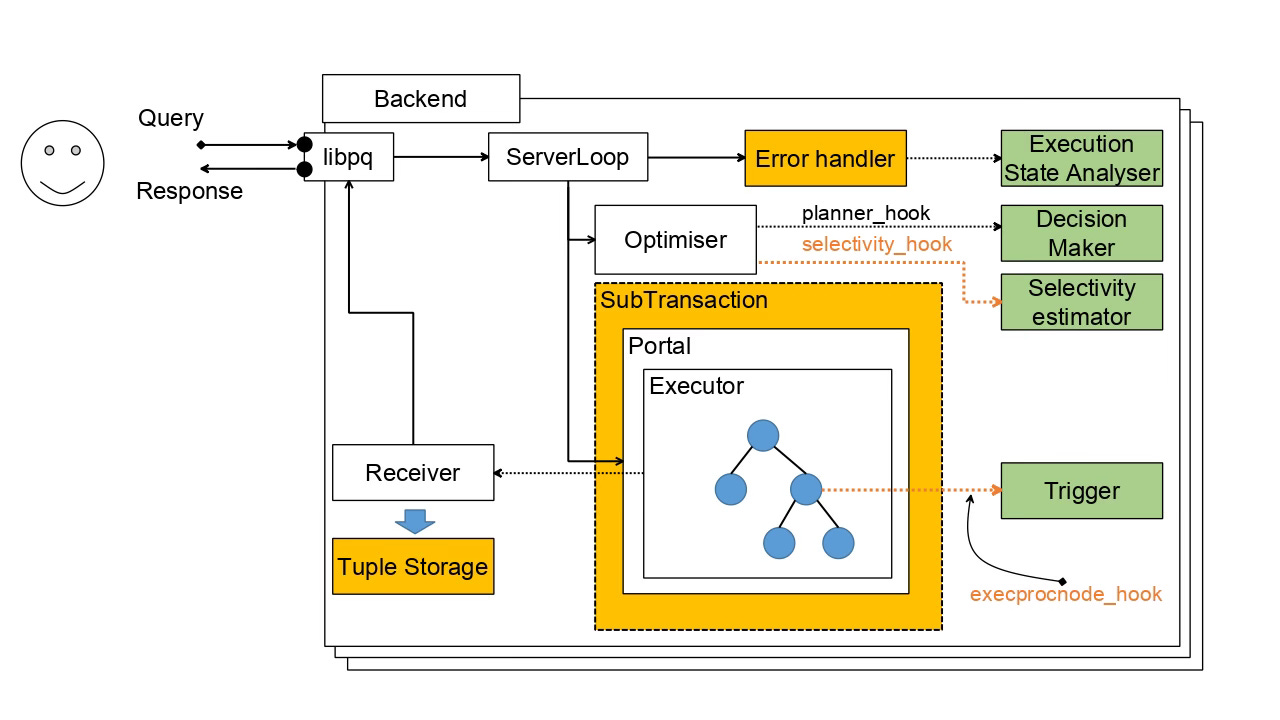
Skipping the lengthy grind sequence of false attempts and a series of unsuccessful code sketches, the architecture ended up with the schema shown below:
You can see the query execution schema with additional elements needed to implement re-optimisation in PostgreSQL. Yellow-coloured elements are in-core features, and green-coloured elements are subsystems that can be pushed out into an extension.
Decision Maker. At first, DBMS should identify queries that can be potentially re-optimised: it doesn't make sense to employ this heavy machinery for trivial queries or single grouping. So, using the planner hook, the user can provide a clue and mark a plan as a 'supervised' one. As an outcome, one custom field was added to the PlannedStmt node to remember the decision has been made before.
Subtransaction. In the case of a query interruption and before the next planning attempt, Postgres must release all acquired resources: locks, pinned buffers, memory, etc. The only way to do it provably correctly is by employing subtransaction machinery. The "Supervised" query must be executed inside such a subtransaction to revert the whole state before re-optimisation and re-execution.
ExecProcNode Hook. During the execution, we have to check a trigger that the user has predefined for the query. This routine should be done from time to time at a place where the executor achieves a consistent state: for example, we shouldn't allow interruptions in the middle of hash table building or sorting - keep in mind that afterwards, Postgres would be able to discover the execution state to find some clues for re-optimisation and this execution state must be in the consistent (for a walker and ROLLBACK codes) state. As I realised, the most reliable place in the code is the ExecProcNode routine.
Trigger. Snapping up the ExecProcNode Hook, the trigger can be defined by a user, parameterised, and exported as a stored C procedure in an extension's UI. It employs the standard Postgres ERROR exception to interrupt execution with a specific error code that can be processed above by the error handler. The trigger has access to the query's Execution State and can watch any part of the query plan if needed. At the same time, it should be simple enough and not produce a lot of overhead for each produced tuple.
Error Handler. So far, the main ServerLoop translates any error coming from the portal to the client. But in the case of re-optimisation, it should catch error signals and, if it is produced by the trigger, it must launch Execution State Analyser before aborting the subtransaction and restarting the query processing, if needed.
Execution State Analyser. Being a simple walker over the plan state, it implements a complicated subsystem for gathering instrumentation data for each node. It is a bit tricky because the current core code doesn't accept partial execution. It grabs an actual number of rows, number of groups, and size of data spilled to disk for the sake of hashing or sorting. As a part of an extension, it can be sophisticated, but not much, limited by the current set of planner hooks.
Selectivity Hook. Using data earned from the partial execution state, an extension should be able to provide the optimiser with recommendations on cardinalities, number of groups, hash table sizes, and even adequate work_mem value. Like the AQO, this feature strictly depends on these hooks. No one such hook exists at the core for now, but the selectivity hook, for example, is discussed and may be committed in the near future.
Selectivity estimator. This is a key subsystem paired with the Execution State Analyser. The most complicated part of this system is the ability to correctly find specific join, scan, grouping, etc, during the early planning stage and match it to the plan node of the finalised plan state. It is the most complicated and invasive technique because Postgres has not conferred this architecturally. Experiments with path signatures in the AQO extension have shown the fragility of such matching. So, in this project, I have chosen a more stable approach based on RelOptInfo signatures. The scope of this post is too limited to explain the idea in detail, but it may be done later if people show an interest in this technique.
Tuple Storage. As you can imagine, re-optimisation and subsequent re-execution are possible if only all results of the query execution are still enclosed inside the backend. However, the Postgres receiver, by default, sends each produced tuple immediately to the client. Because the first message sent out from the instance disables the re-optimisation trigger, it was necessary to invent a tuple storage that allows the delay of the data shipment to the client for some time (limited by tuple buffer size) and do re-optimisation, if needed.
Implementation caveats
The relatively simplistic design faced multiple difficulties during development in the sophisticated code of a well-rounded database system like PostgreSQL. The first problem that immediately bubbled up was dynamic query execution, as shown in the picture below.
A query can contain a function call. Such a function, in turn, can contain quite complex logic and execute queries inside the body. Their planning and execution happen in an independent and isolated execution context somewhere in the middle of the execution of a top-level query. So, the feature should identify such a recursion and, in case of interruption, process the correct PlannedStmt tree. Moreover, functions can manage exceptions and employ saving points. Because of that, we should be careful and disable re-optimisation if it happens inside a function call.
At the moment of interruption, some nodes will be in an interim state when they have called ExecProcNode to obtain another tuple. The current Postgres ExecutionEnd walker doesn't process this state correctly, and such a state must be implemented inside instrumentation structures. This change is also profitable for the pg_query_state extension and other tools that make snapshots of the query plan and want careful calculations of each node's cardinality.
How to finalise a partially executed query. It is not apparent, but query execution could involve parallel workers who are independent processes. When we interrupt execution in the primary process, it doesn't mean that workers will stop their work immediately after that. They will work for an arbitrary period of time, and it appears that the task of finalising their work and gathering instrumentation data is not so easy.
One more problem is figuring out when to switch off re-optimisation. If a trigger interrupts query execution, it should make sense. For example, if you set up the execution time trigger to one second, but the query can't be executed for less than one minute, it could waste repeating replanning without any meaningful effect just because most of the nodes may not even have processed a single tuple. My quick solution was introducing a trivial approach of seeing if something meaningful was earned since the last re-optimisation. If re-optimisation doesn't change anything in the plan or even earned new data from partially executed state it is allowed to relieve the trigger conditions - for example, increasing a timeout value or memory usage.
The next problem relates to the signature technique. Being a hash value, it can occasionally match the signature of two totally different nodes. If these plan nodes have highly different cardinalities (for example, one and 1E6), this can cause fluctuations in the cardinality prediction provided by the selectivity estimator. As a trivial solution, I just set a limit to the maximum number of re-optimisations for one query execution, but it does not seem to be the best solution.
A quite trivial but still existing problem is plpgsql information messages, which can produce some accidental output during the execution. To make this output consistent (do not send duplicate messages because of the query execution restart), we need to hold off on their delivery to the client until re-optimisation is possible and the query is not finished yet.
How does it help?
Multiple triggers can be invented: time, cardinality error, memory consumption, temporary file quota, etc. The architecture also allows a user to define custom triggers for specific purposes. In that particular case, we have chosen a variable-time trigger. To make this more practical, we added some flexibility to this trigger. If the statement_timeout value is set, the re-optimiser can increment the time gap (up to statement_timeout) if nothing beneficial has been earned since the last re-optimisation iteration.
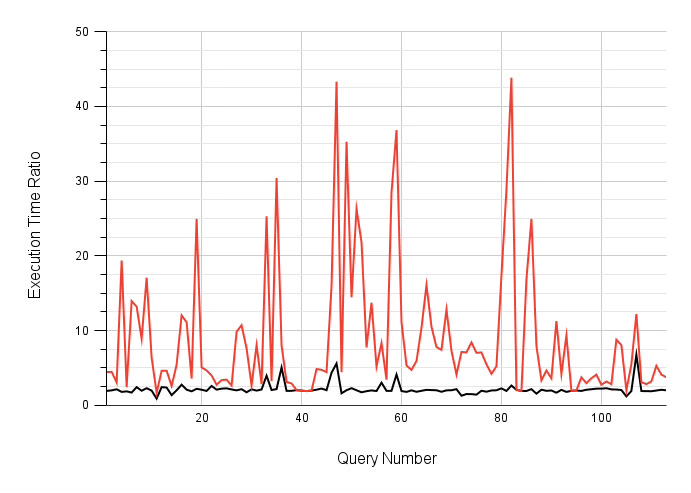
So, before launching this benchmark, I set the initial time trigger to 1 second and statement_timeout to about 10 minutes (see the script for details). The result of the benchmark execution is shown on the graph below (see Google Docs tables for raw data). Here, you can see a black line representing relative execution time (without parallel workers with re-optimisation divided by the case with a single parallel worker, no re-optimisation).
Compared to the previous graph, you can see that the peak 50-500 decrease (and not finished executions, too) have been fixed by re-optimisation. Only some spikes making some queries up to 6 times slower represent poorly planned queries that can be justified as some issues in our re-optimisation logic that is still a beta version.
The red line on the graph represents the total execution time of each query, including all re-optimisation iterations. From this standpoint, the outcome of the feature employment doesn't look so appealing: Postgres has spent much time in iterative partial executions, which tells us that blind re-optimisation is impractical in real life.
It is a dumb feature, isn't it?
Observing the results of the JOB benchmark, it is evident that in most cases, the total query execution time, including all the re-optimisations, is much higher than just one, maybe non-optimal execution. So, instead of speeding up, we have degradation, haven't we?
It is true. Using alone, this feature has too narrow a use case and doesn't make sense in practice. The only cases I see here are debugging and debriefing. But remember, a few weeks ago, I presented the plan freezing extension to you. Imagine, what if you can unite re-optimisation and plan freezing?
The most questionable part of the freezer is how to identify poorly planned queries and how to force Postgres to build a more optimal plan. It is precisely what the re-optimiser does! As a result, we can create a kind of self-tuning DBMS, which will 'adapt' to changed data and load. When setting triggers and calling the plan freezer after some profitable re-optimisation, Postgres will stick query plans into the cache. Control of the frozen plan's effectiveness can also be implemented by a time trigger, which can be explicitly set for the plan to the value outreaching, for example, by 20% of the initial execution time. And now re-optimisation makes sense, doesn't it?
So, the purpose of this work was much broader than just developing a prototype of a re-optimisation feature. I aimed to invent a general approach underpinning query optimisation decisions, correcting mistakes, and eventually conserving CPU cycles ;) that can be at least partially autonomous and do not require vendor lock. This approach, as I believe, is doable and workable and can be profitable, especially in cloud configurations. Do you think it is worth a separate startup project?
THE END.
August 18, 2024. Paris, France
P.S.
Links:
Join Order Benchmark repository:
https://github.com/danolivo/jo-benchDocker container with the re-optimisation patch: https://hub.docker.com/r/danolivo/reopt
Utility files for the test reproduction:
https://github.com/danolivo/utility/tree/main/job-noworker-issue
Names of the GUCs have been introduced with re-optimisation:
query_inadequate_execution_time - time trigger (in ms) - will start re-optimisation if the current execution time overreaches this value.
replan_overrun_limit - factor to identify acceptable cardinality prediction error in a plan node until re-optimisation starts.
replan_enable - enable/disable re-optimisation
show_node_sign - show details of re-optimisation in EXPLAIN.
replan_signal(pid) - routine to manually cause re-optimisation in the process


